Two factors are underrated again and again in energy policy: the potential of better energy efficiency (check here) and that of renewable energy. In Paris, world leaders have affirmed their intention to restrict global warming to 2 oC or less. In order for this to become true, global energy consumption needs to level off and renewable energy sources need to grow very fast. Major energy forecasters are still far removed from such scenarios. But present trends show that this might done. A common sense energy scenario.
This is the first article in a series on the forthcoming book by Alle Bruggink and Diederik van der Hoeven: More with Less, Welcome to the Precision Economy. The articles appeared on 30 October and 2 November 2016, and 24 January, 14 February, 18 March and 30 March 2017.
We can characterise energy scenarios by the year that they project renewable energy to come at the same level as fossil energy, the 50-50 ratio. Major forecasters like Shell, BP and the International Energy Agency (IEA) project this moment well after 2050. But present trends put this point much earlier in time, somewhere around 2040: the 50-50-40 scenario. We did not make an elaborate scenario study but just point out some trends to substantiate this view (1).

Demand growth in the common sense energy scenario
First of all, we should note that growth in world energy consumption (and production) slows down, it might even have come to a standstill altogether (‘peak energy consumption’).
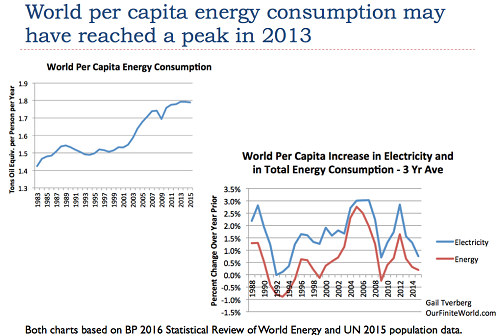
• World per capita energy consumption has not grown for 3 consecutive years, if there is any growth in energy consumption at all, it appears to be at the rate of population growth. See figure 1.
• In the past 40 years, world production (the economy) grew by ca. 3½% p.a., which equalled ca. 2% p.a. world production growth per capita. What did this imply for world energy consumption? Over the past 20 years, the energy intensity of the world economy (the amount of energy required to produce $1 of national product) decreased by some 1½% p.a. [link] So a world economy growing at 2% p.a. per capita, requires an amount of energy per capita that grows by just ½% p.a. And the trend is downwards. As said before, growth in this area has been zero for the past 3 years. On top of that, world population growth has slowed down as well, and will slow down further.
• China is the energy efficiency champion of the world by far. In 2015, its energy efficiency rose by a staggering 5.6%, according to the IEA. At such rates, China’s energy consumption will not increase much anymore from here. Whereas in the industrialized world, total energy consumption has been stagnant or falling for quite some time already.
Therefore, a common sense energy scenario will see world energy consumption per capita remain constant, and total global energy consumption grow by some 19% till 2035, from ca. 13,900 million tons of oil equivalent (mtoe) (2015) to ca. 16,600 mtoe (2035). This equals to a growth of about 0.8% p.a.
World peak energy consumption
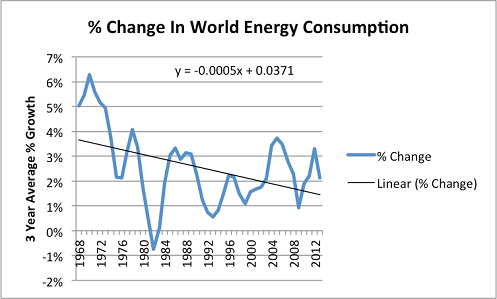
We get much the same result from a historic analysis of the growth of world energy consumption, see figure 2 (source: Gail Tverberg). Extrapolating along this trend curve, we will attain 0% growth in 2042. From then onwards, the curve predicts that world energy consumption will not grow anymore and might even fall. It would peak 24% higher than in 2013 at a level of 16,790 mtoe. In 2035 it would amount to 16,598 mtoe.

How does this compare to scenarios for world energy consumption by the major forecasters in this field, Shell, BP and IEA? Our scenarios have a rather good fit with the latest IEA ‘New Policy’ scenarios (the last freely available scenario study is from 2012). And in the past, IEA projections had a good fit with actual outcomes as well, see table 1. Here, we listed as ‘IEA low’ and ‘IEA high’ the lowest respectively highest projections for the year in question.
Year IEA low IEA high Actual Trend IEA NP
2000 8,817 9,348 9,179
2010 11,132 12,842 12,730
2015 13,488 14,071 *13,900
2020 14,773 14,922
2035 16,598 17,197
*Our estimate
IEA NP = New Policies
Table 1. Forecasts and realisations in world energy supply, in million tons of oil equivalent (mtoe).
IEA has a good track record in forecasting world energy consumption, although it struggled to forecast the high growth rate between 2000 and 2010, resulting from China’s (and to a lesser extent India’s) rapid industrialisation. It forecasts a slowdown in growth now, as we would expect as China’s energy intensity quickly falls. The good news here is that world energy consumption will stabilise. The bad news is that this will not be at a level sufficiently low to restrict global warming to 2 oC. So we do need extra policies that reinforce the slowdown in growth that we highlighted. The IEA 450-scenario (so called because its goal is to stabilise CO2 concentration in the atmosphere to 450 ppm) projects 14,793 mtoe in 2035, which implies that global energy consumption would have to peak by 2020 already in order to prevent irresponsible global warming.
Shell and BP project even higher energy demands
The latest BP scenario shows a global energy demand of almost 18,000 mtoe in 2035, and still rising. In its various recent scenarios, Shell predicts as much as 60% more energy demand in 2040, and 80% in 2050. In order to counter worries about CO2 emissions, Shell proposes the large-scale deployment of carbon capture and storage (CCS), but BP seems to be much more sceptical about this. And so are we. Therefore, we predict a lot more CO2 coming if these scenarios would come true – but as we argued, we do not judge this to be likely.
So far, in our common sense energy scenario we just looked into total energy demand. In the second part of this column we will look into sustainable energy production. Can sustainable energy sources reduce appreciably the use of fossil fuels (and prevent CO2 emissions)?
(1) We do not pretend that extrapolating trends is the best way to make energy scenarios. The major scenario builders have tens of staff that work all year on this subject, on a very detailed, sector-by-sector and country-by-country basis. But we feel that the range of options is narrowing down and that differences between scenarios get smaller, an argument to see how far a common sense energy scenario would take us.
Also read part 2: renewable energy.
